|
Advanced Phylogeographic Visualization
|




|
|
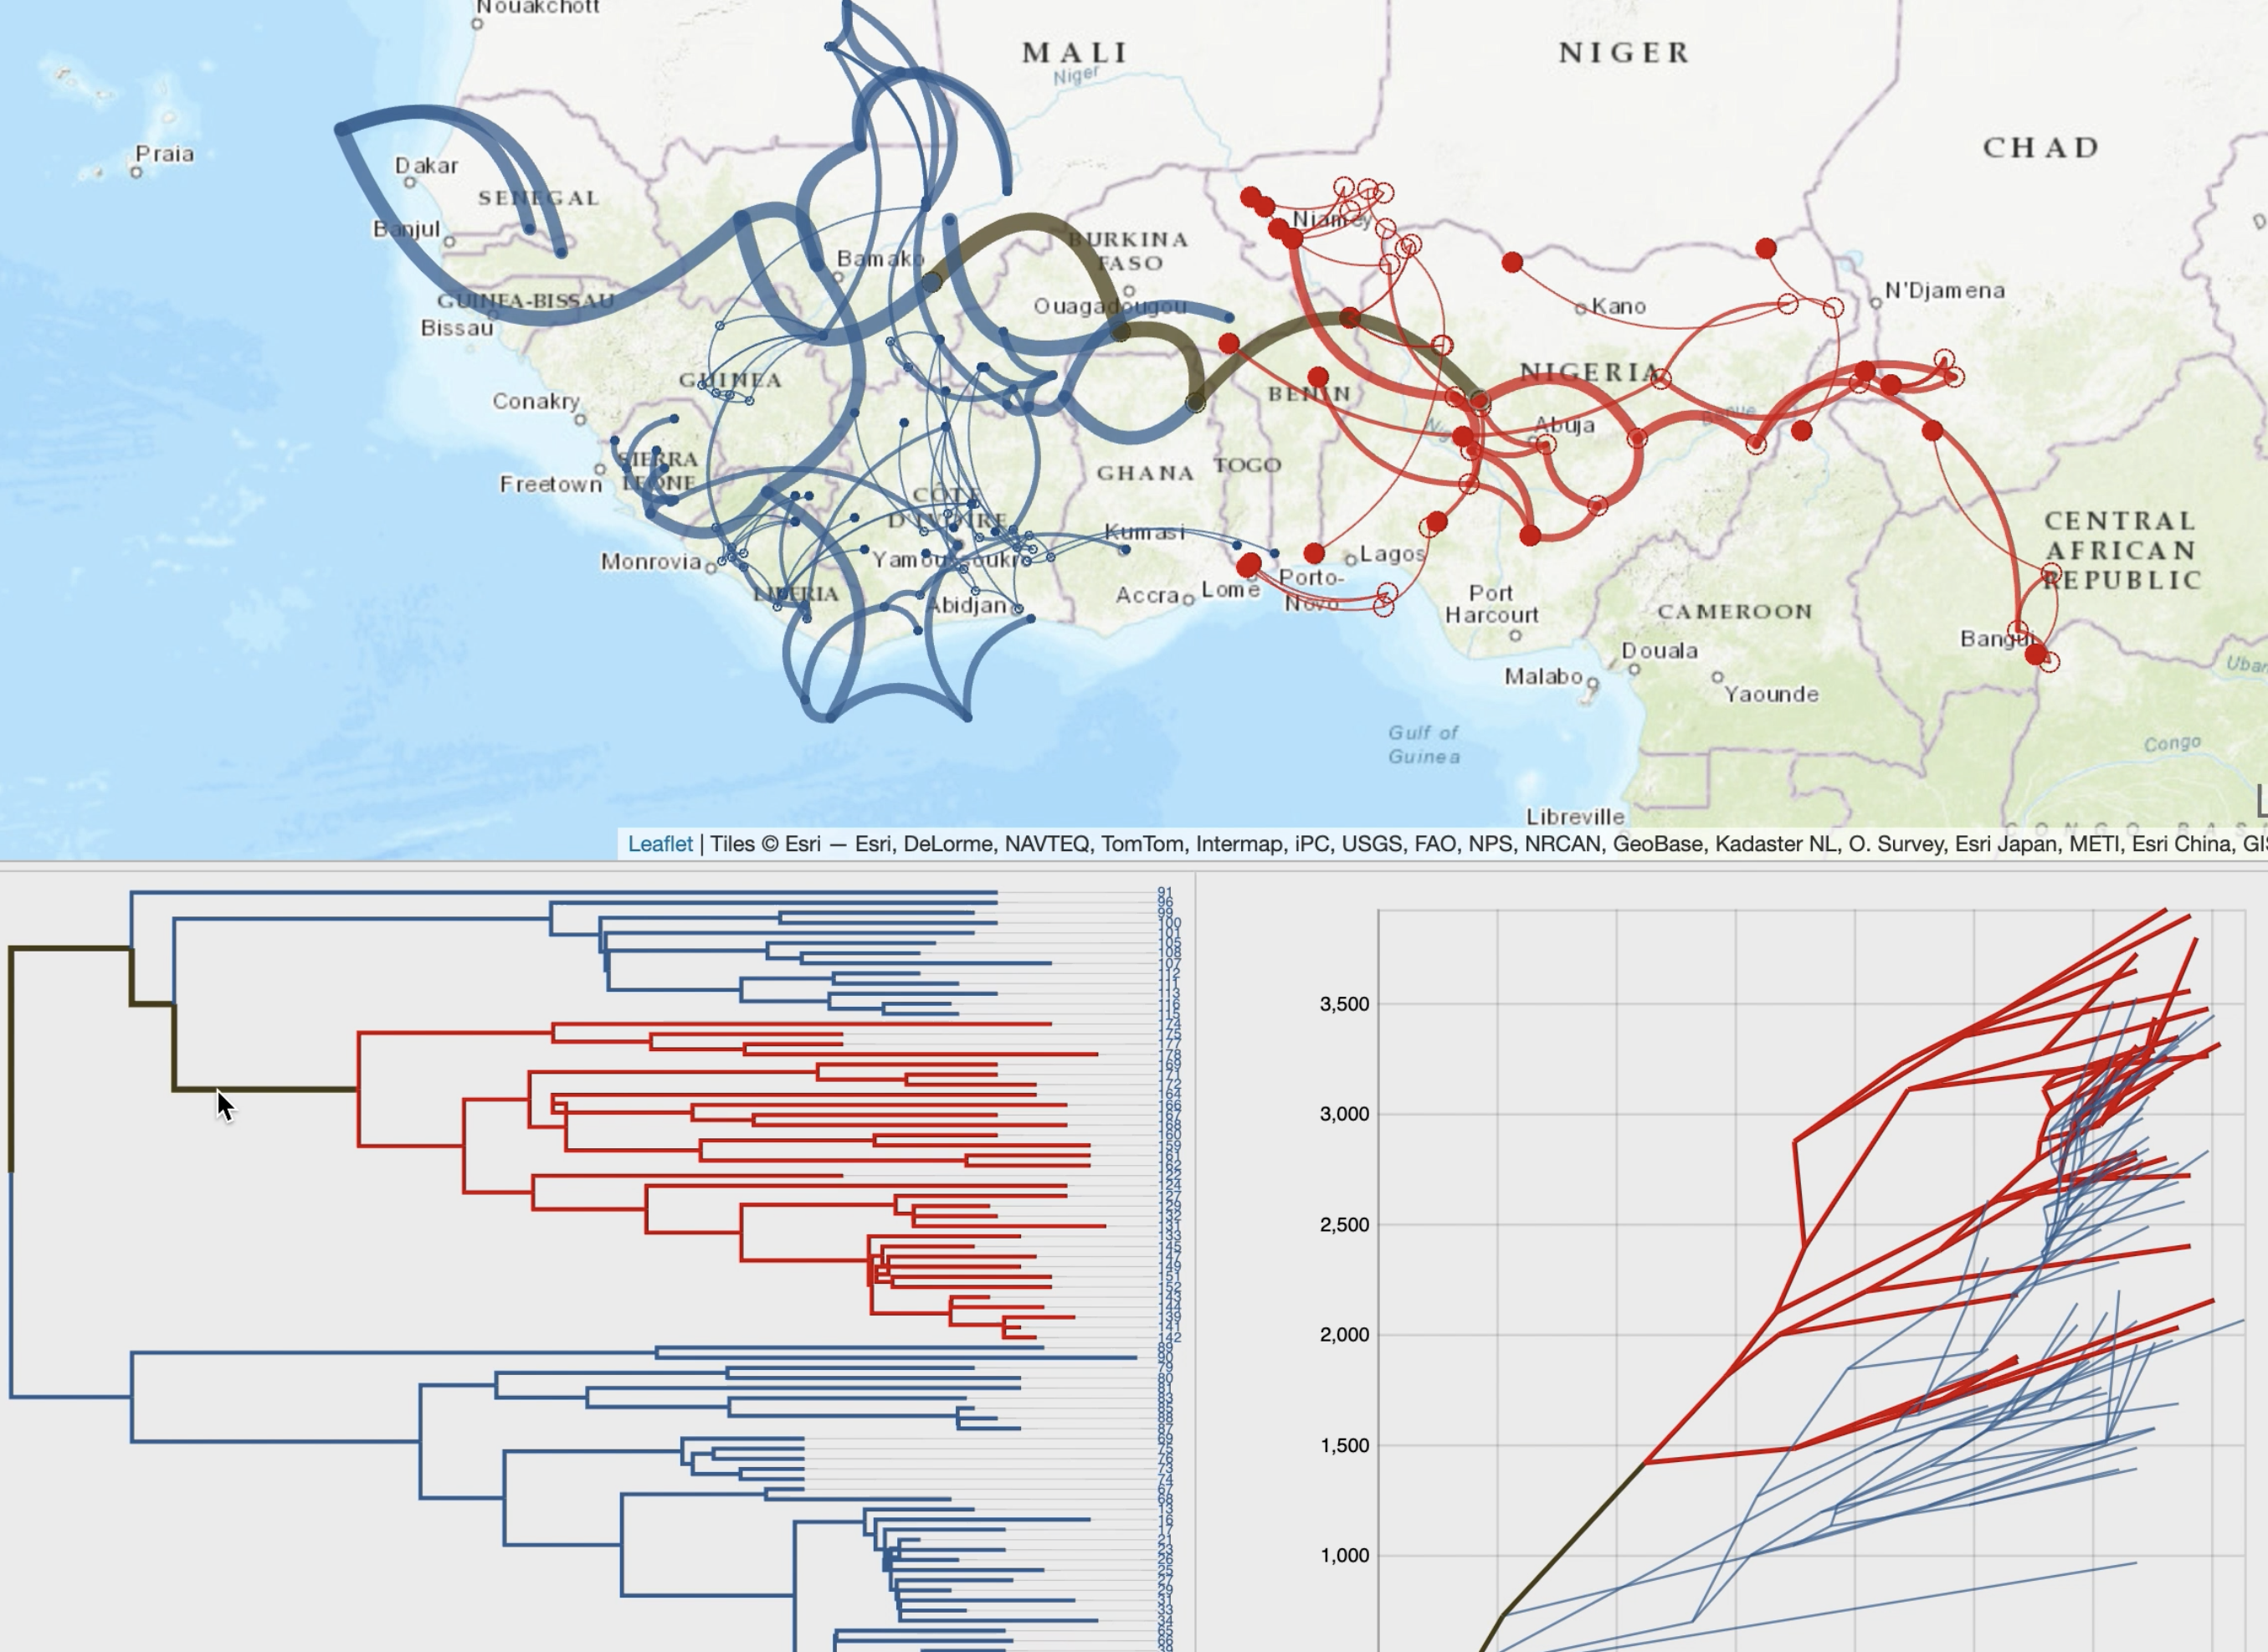
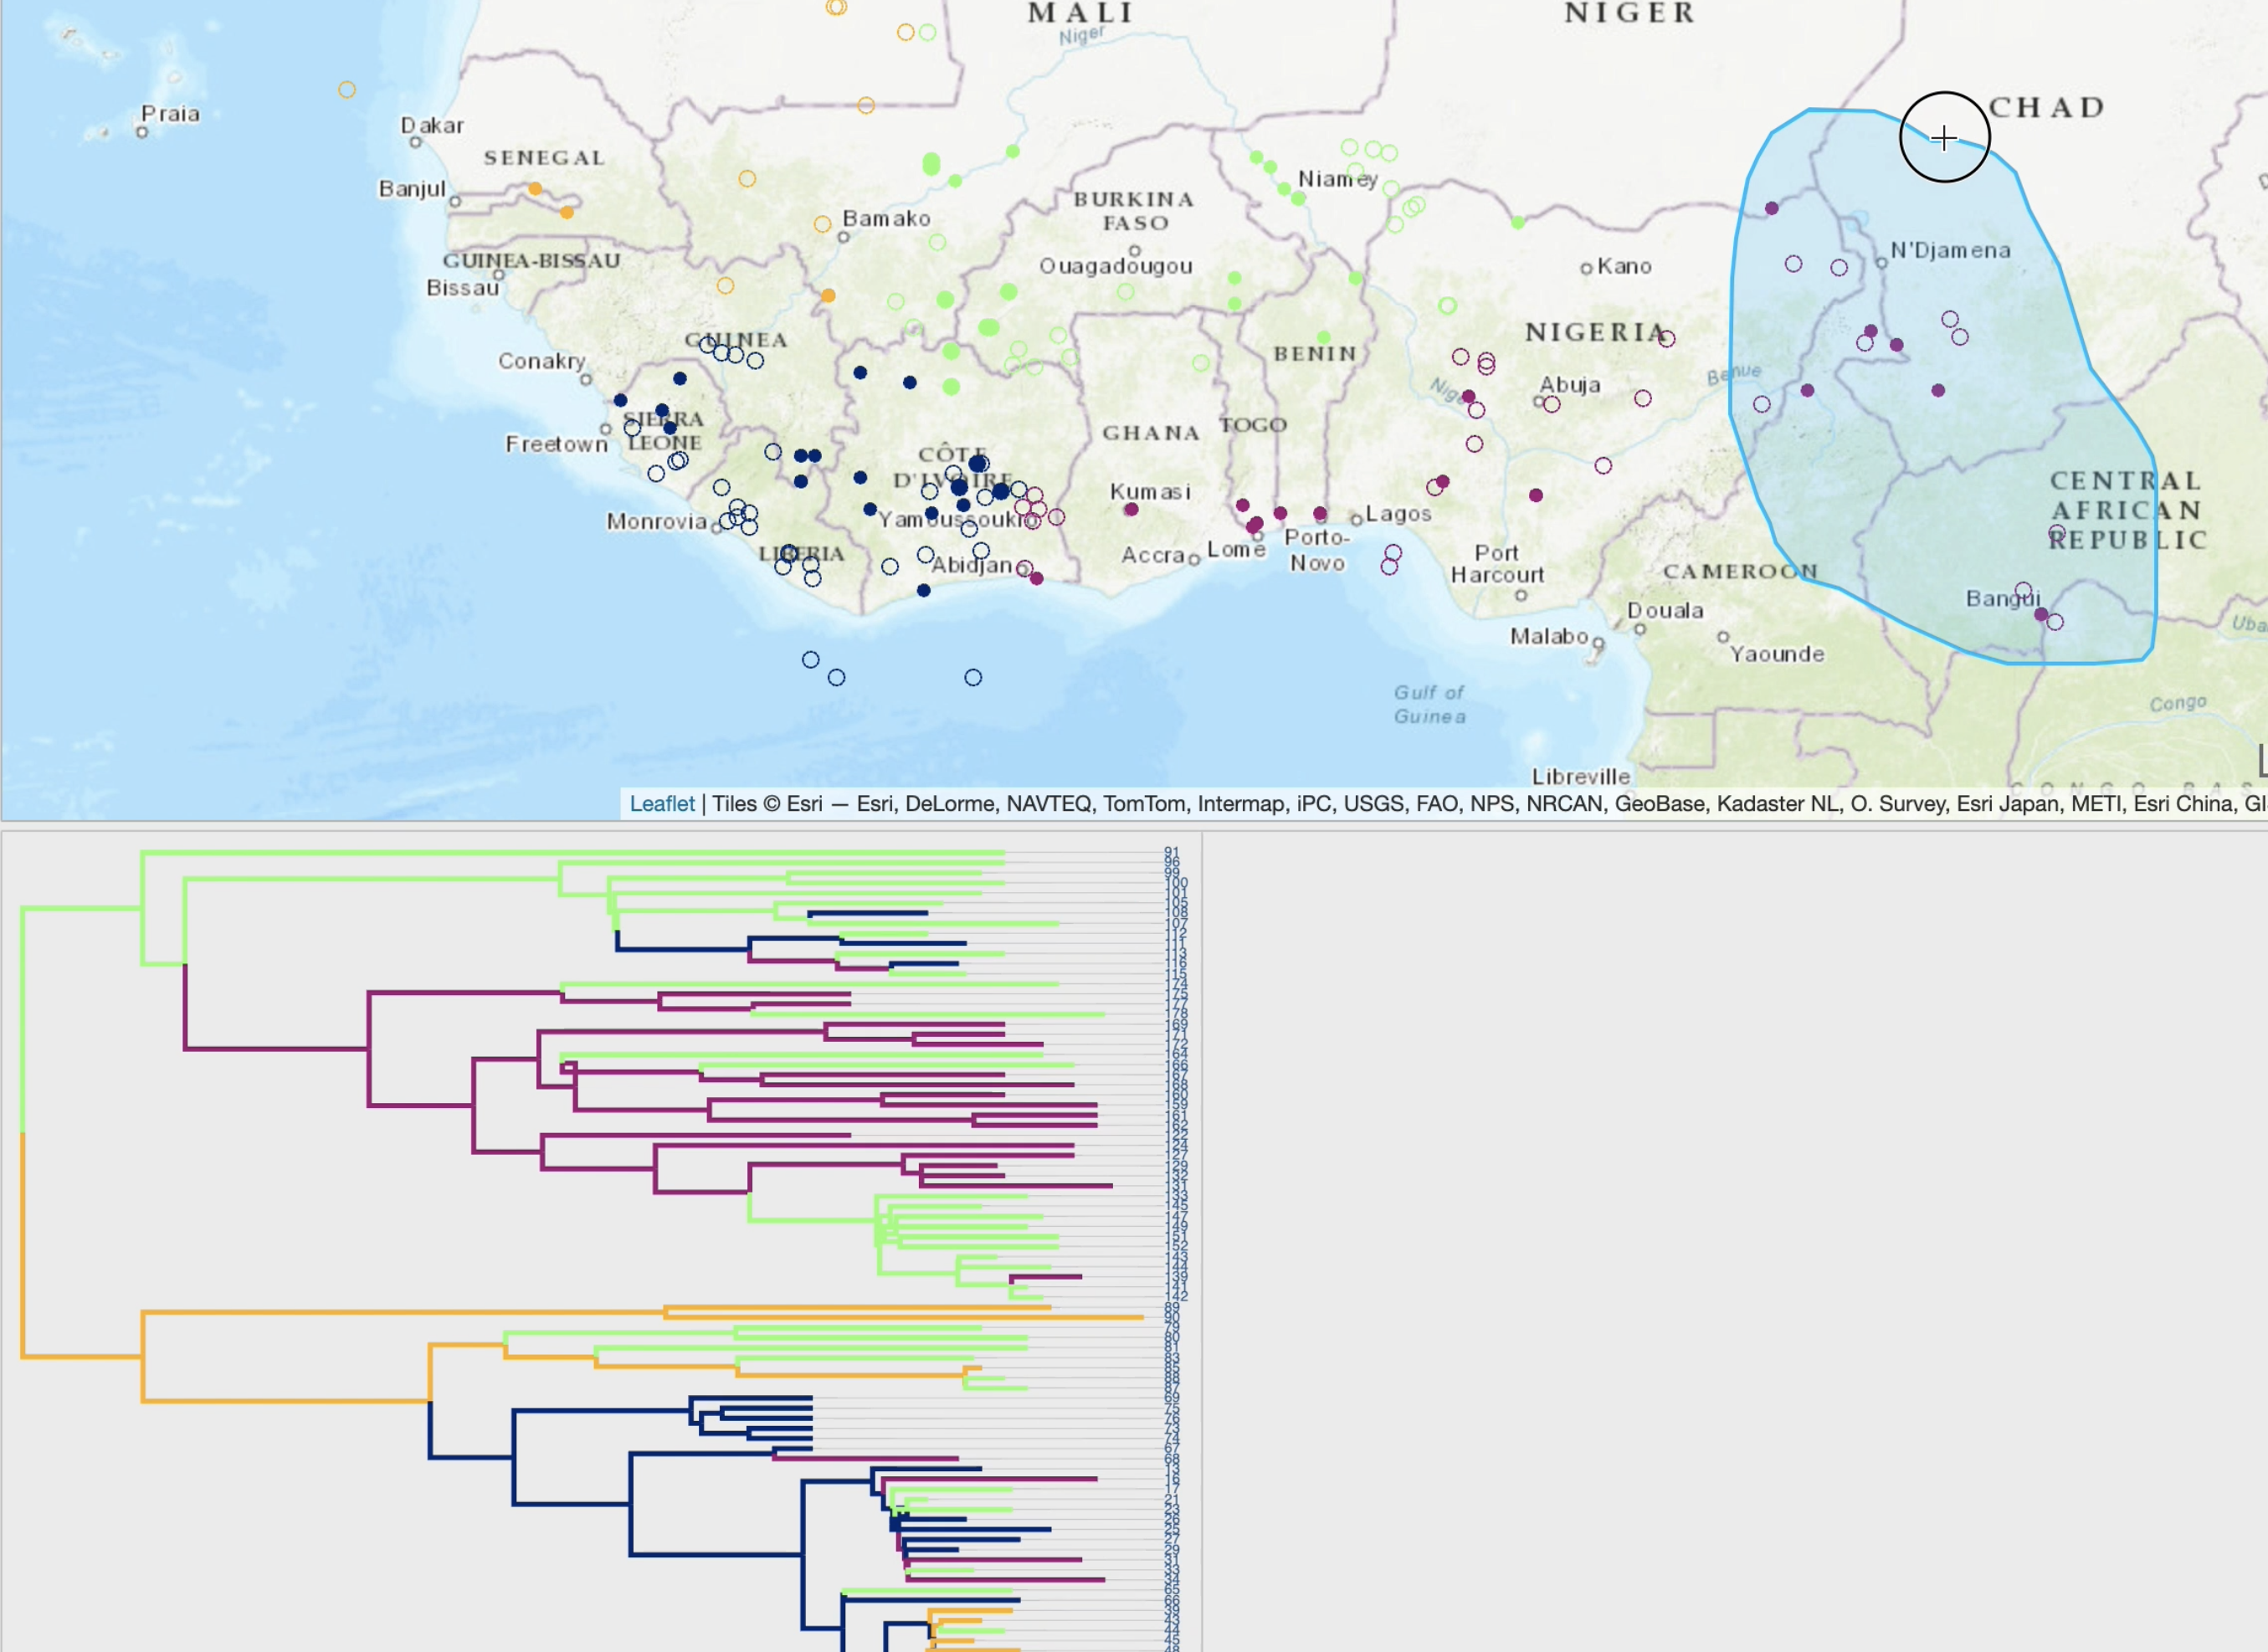
EvoLaps is a user-friendly web application designed to visualize the spatial and temporal spread of pathogens.
It takes as entry an annotated tree, such as a maximum clade credibility tree obtained through continuous phylogeographic inference.
By following a 'Top-Down' reading of a tree from the root to its leaves recursively, transitions (latitude/longitude changes from a node to its children)
are represented on a cartographic background using graphical paths. The complete set of paths forms the phylogeographic scenario.
A raw reading of these transitions produces complex scenarios, and EvoLaps helps to analyze them with:
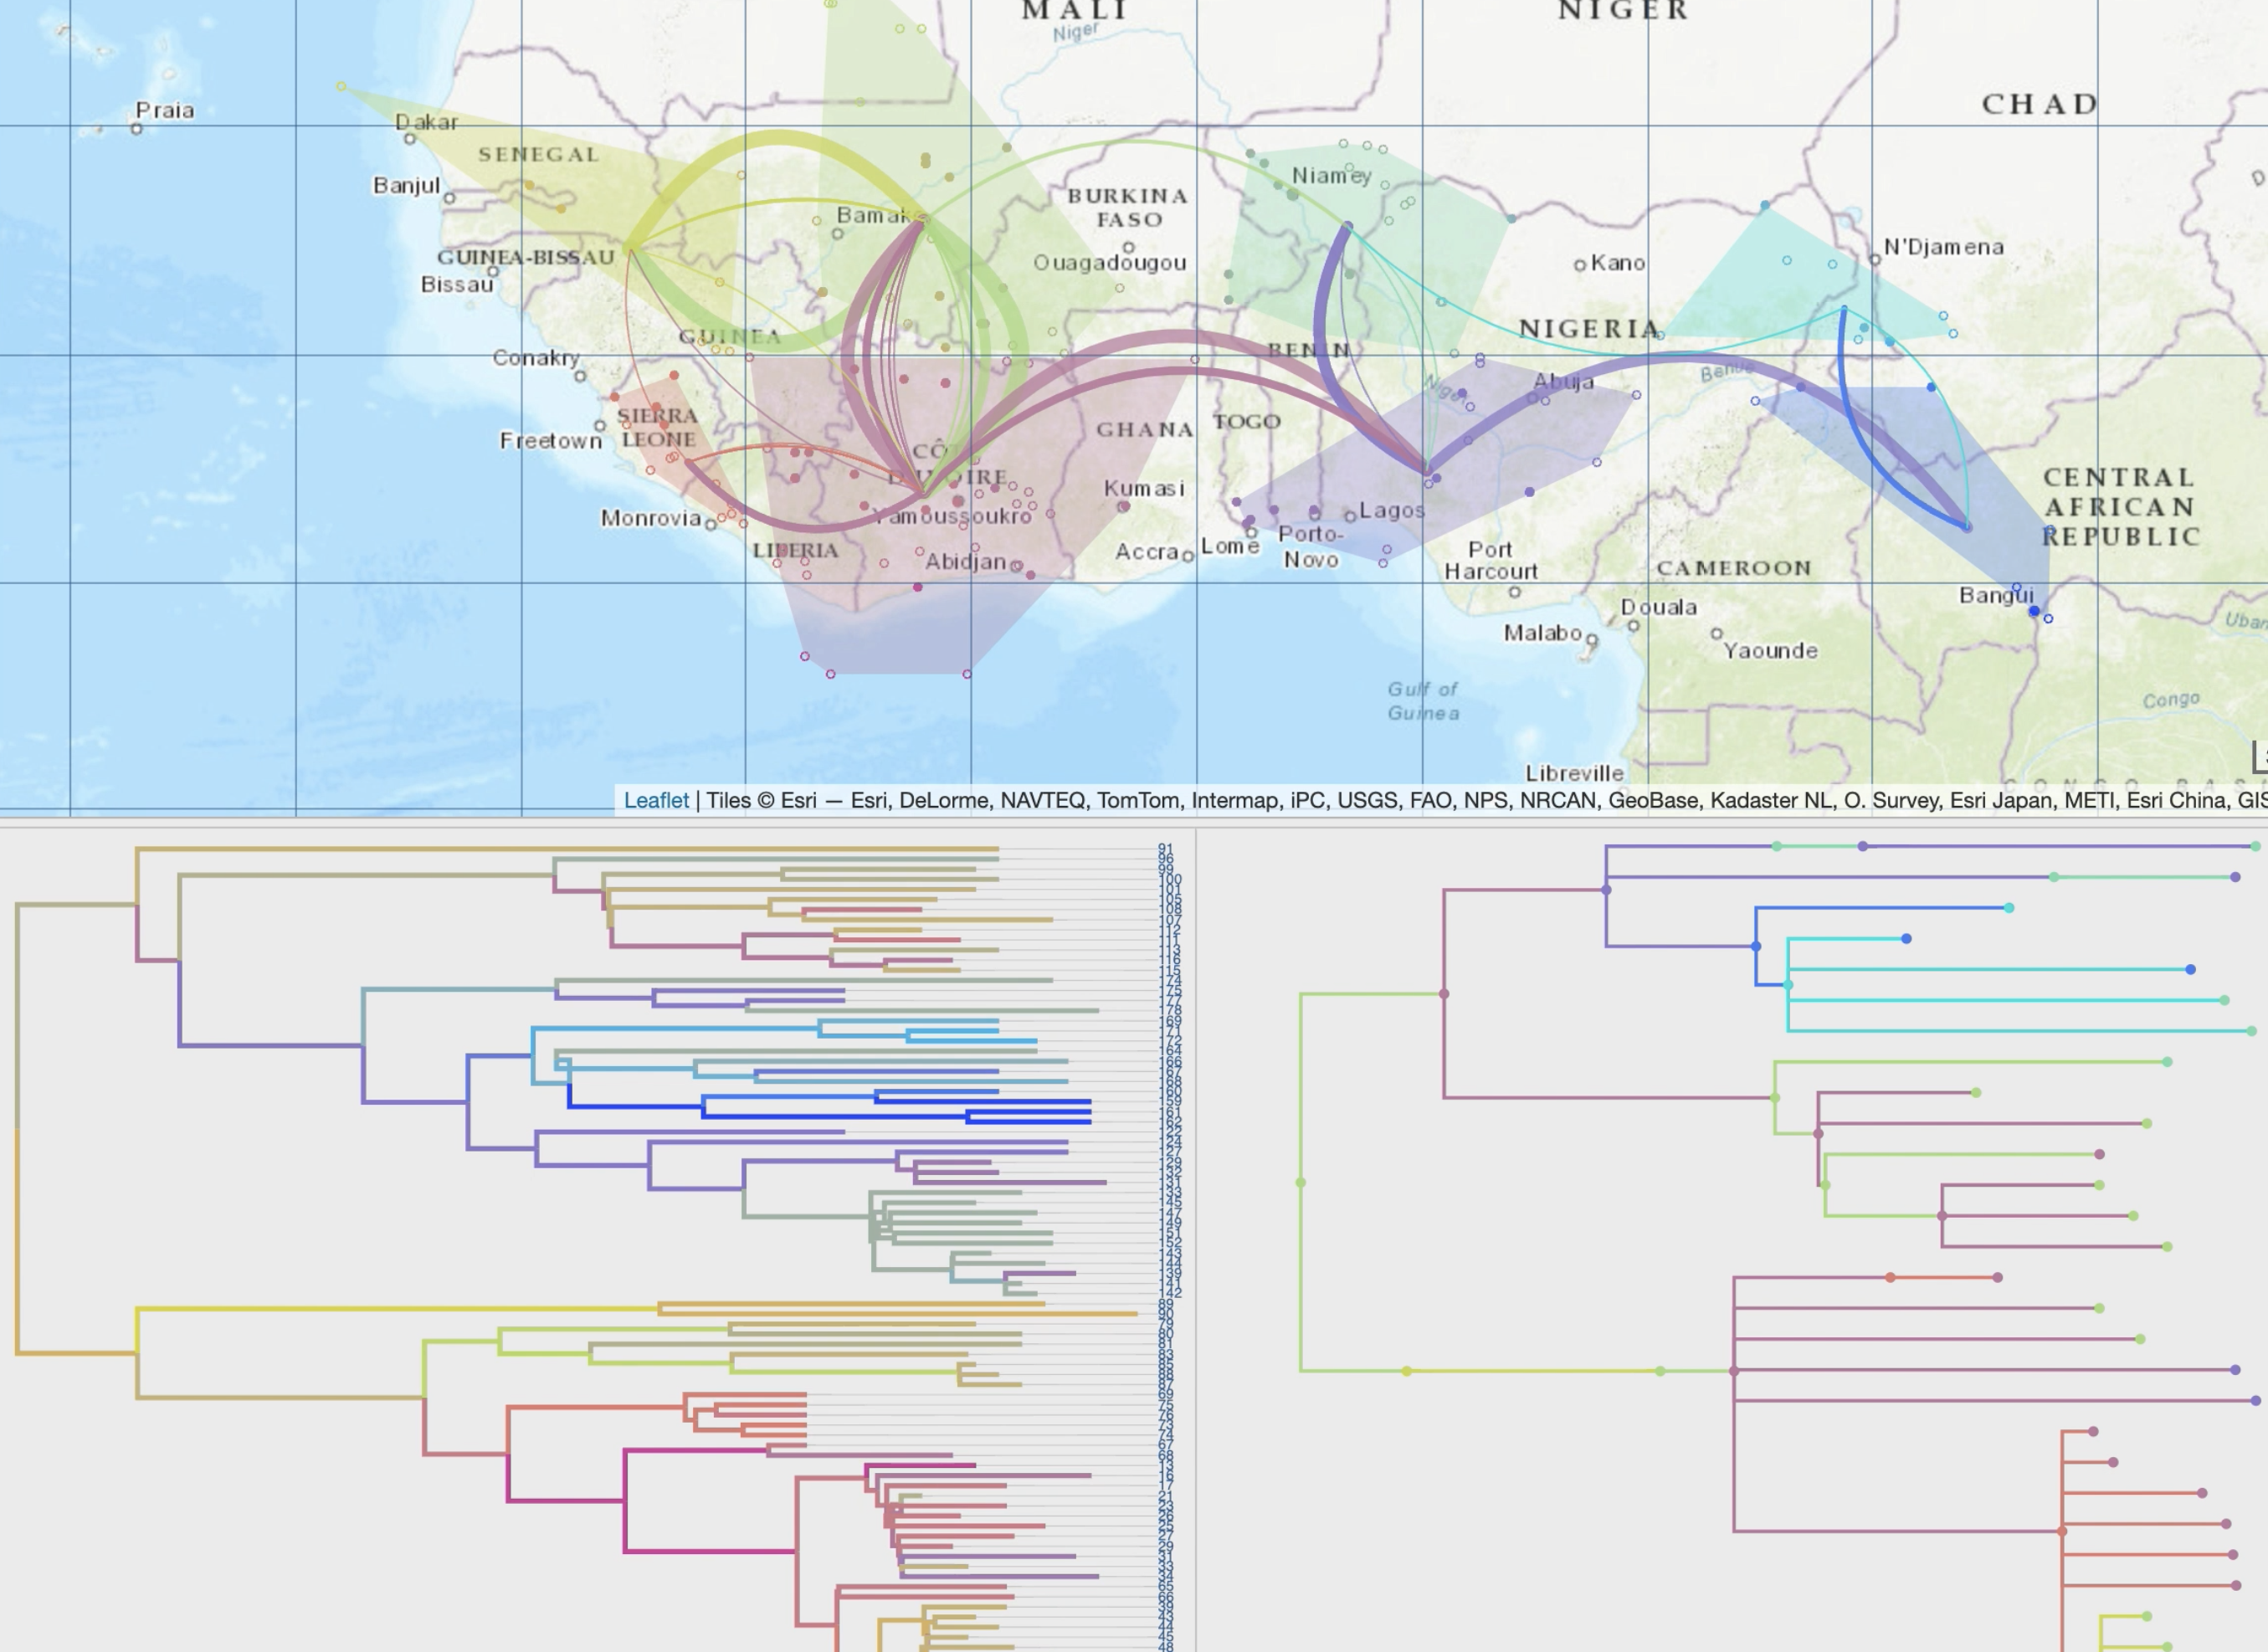
• enhanced path display using multiple graphical variables with time-dependent gradients (line thickness, curvature, opacity, color)
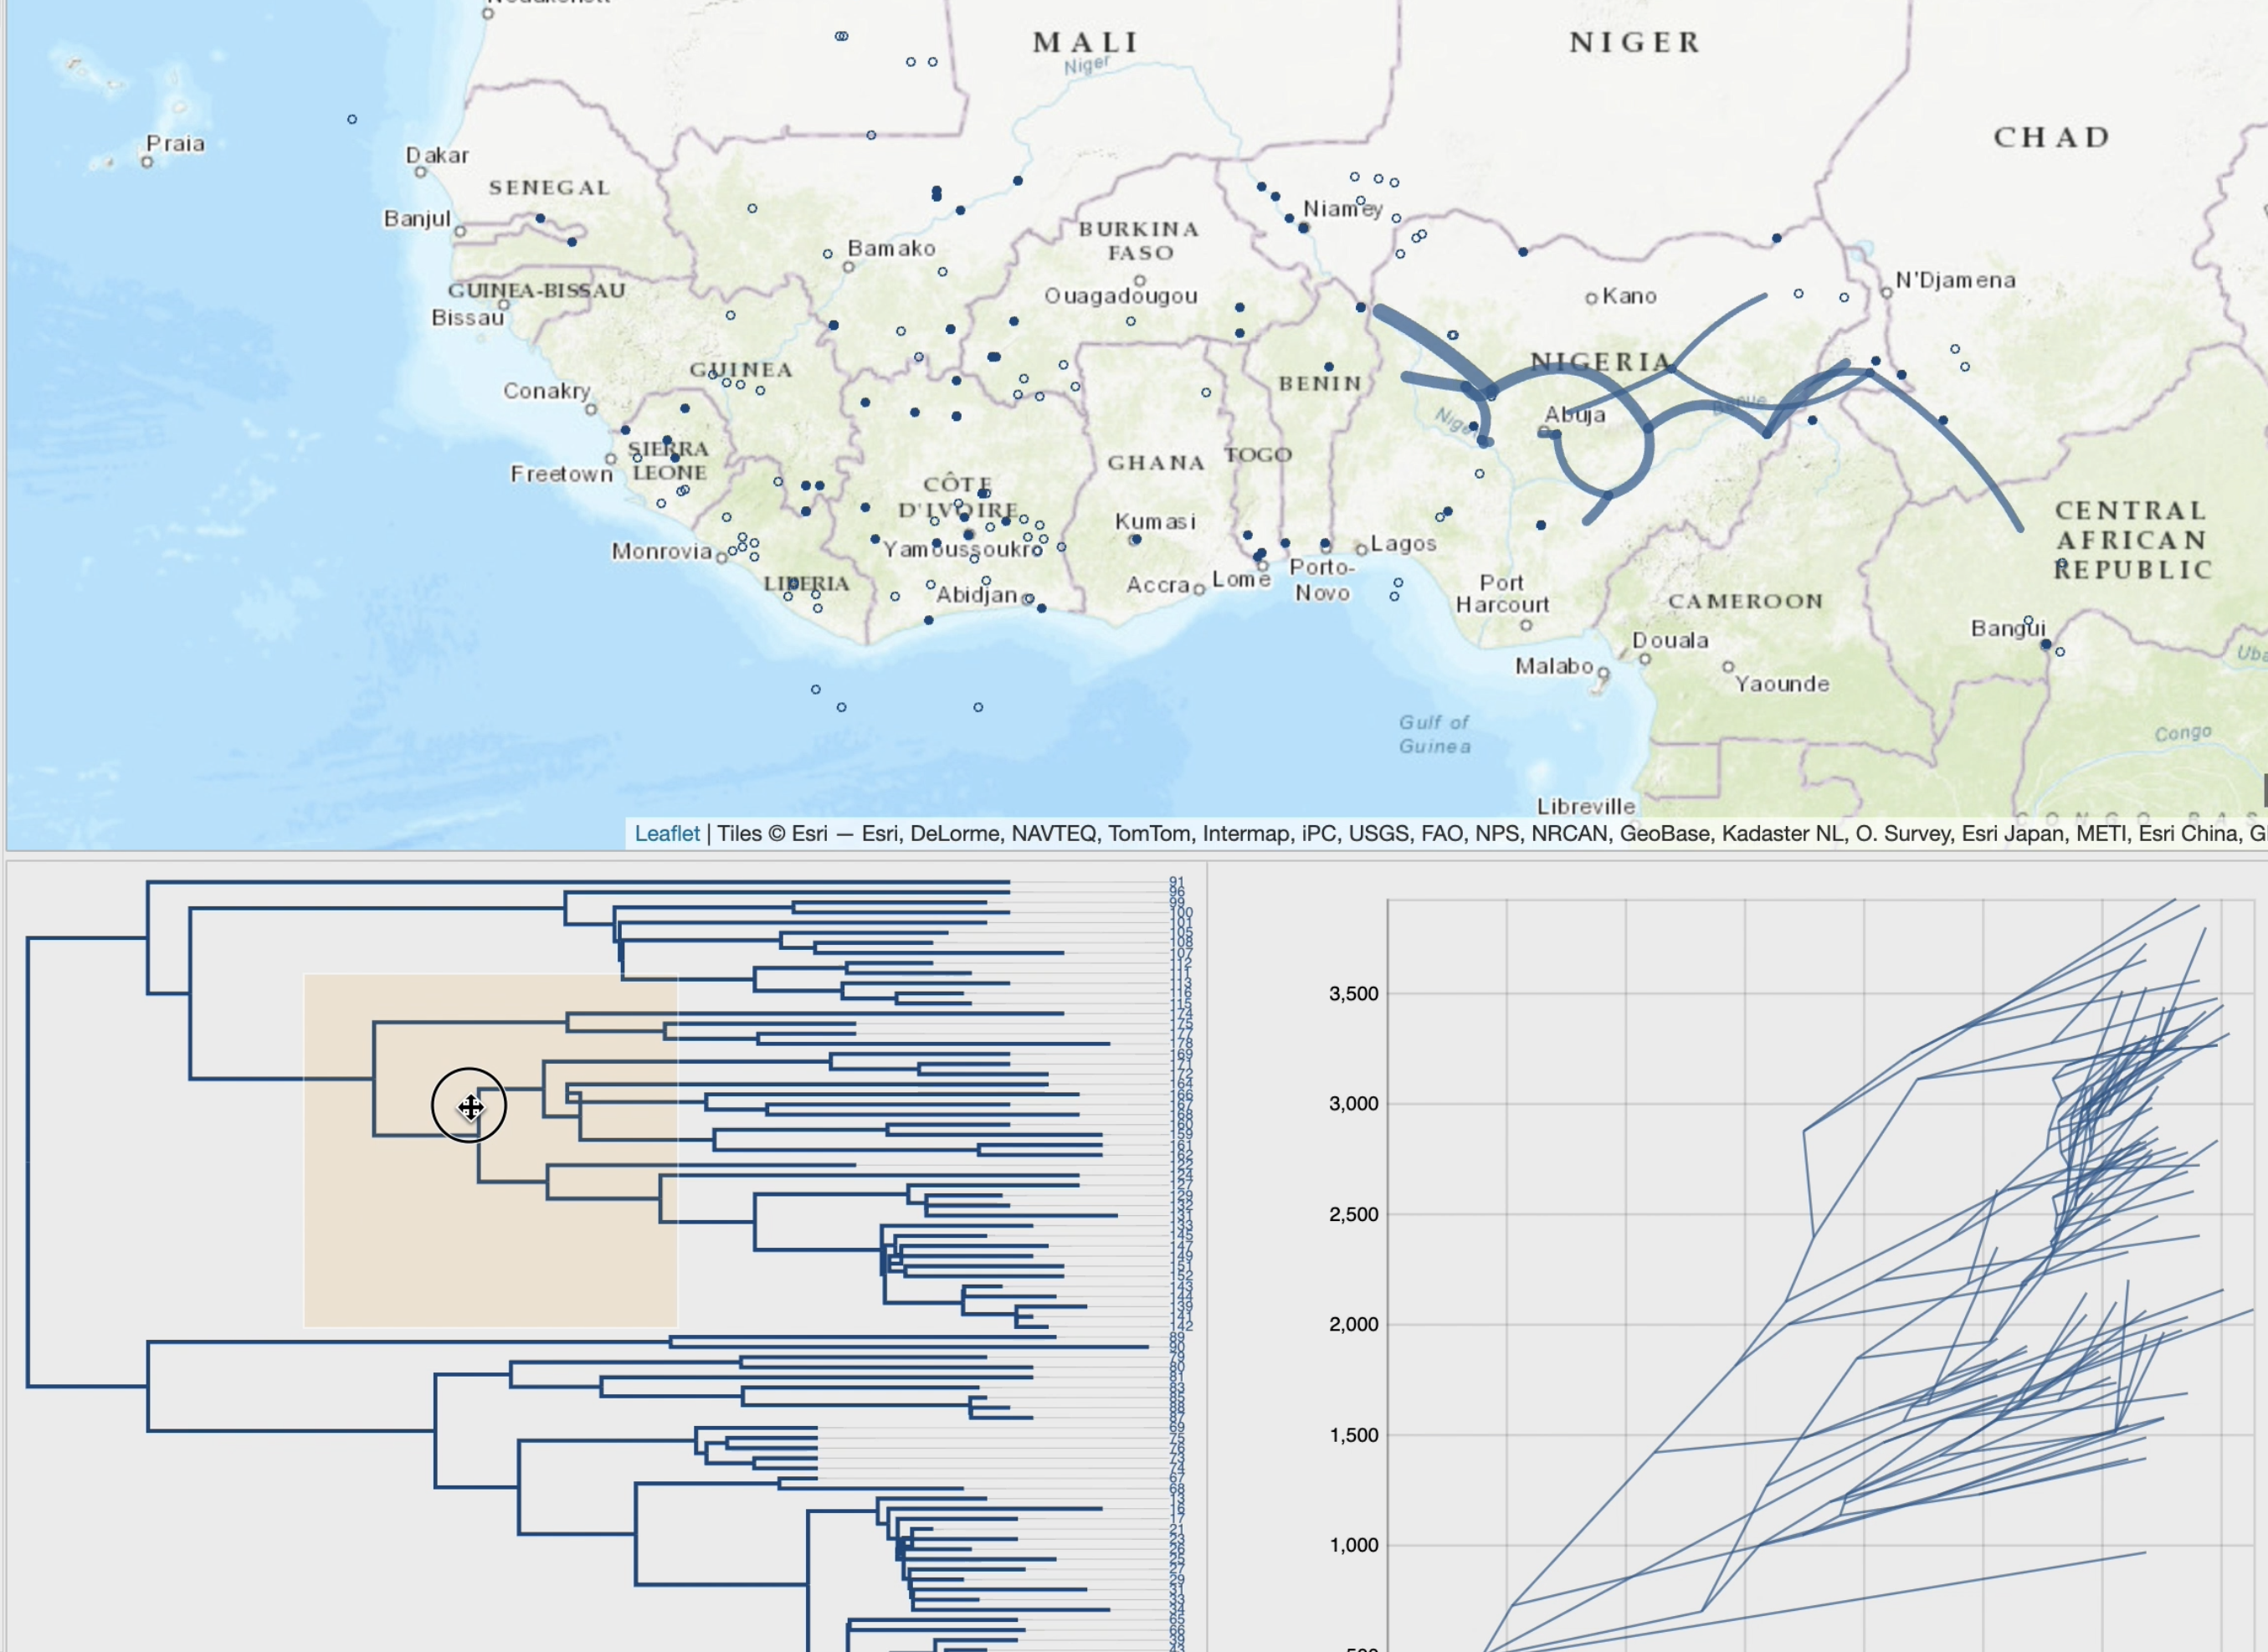
• cross-highlighting and selection capabilities between the phylogeographic scenario and the phylogenetic tree
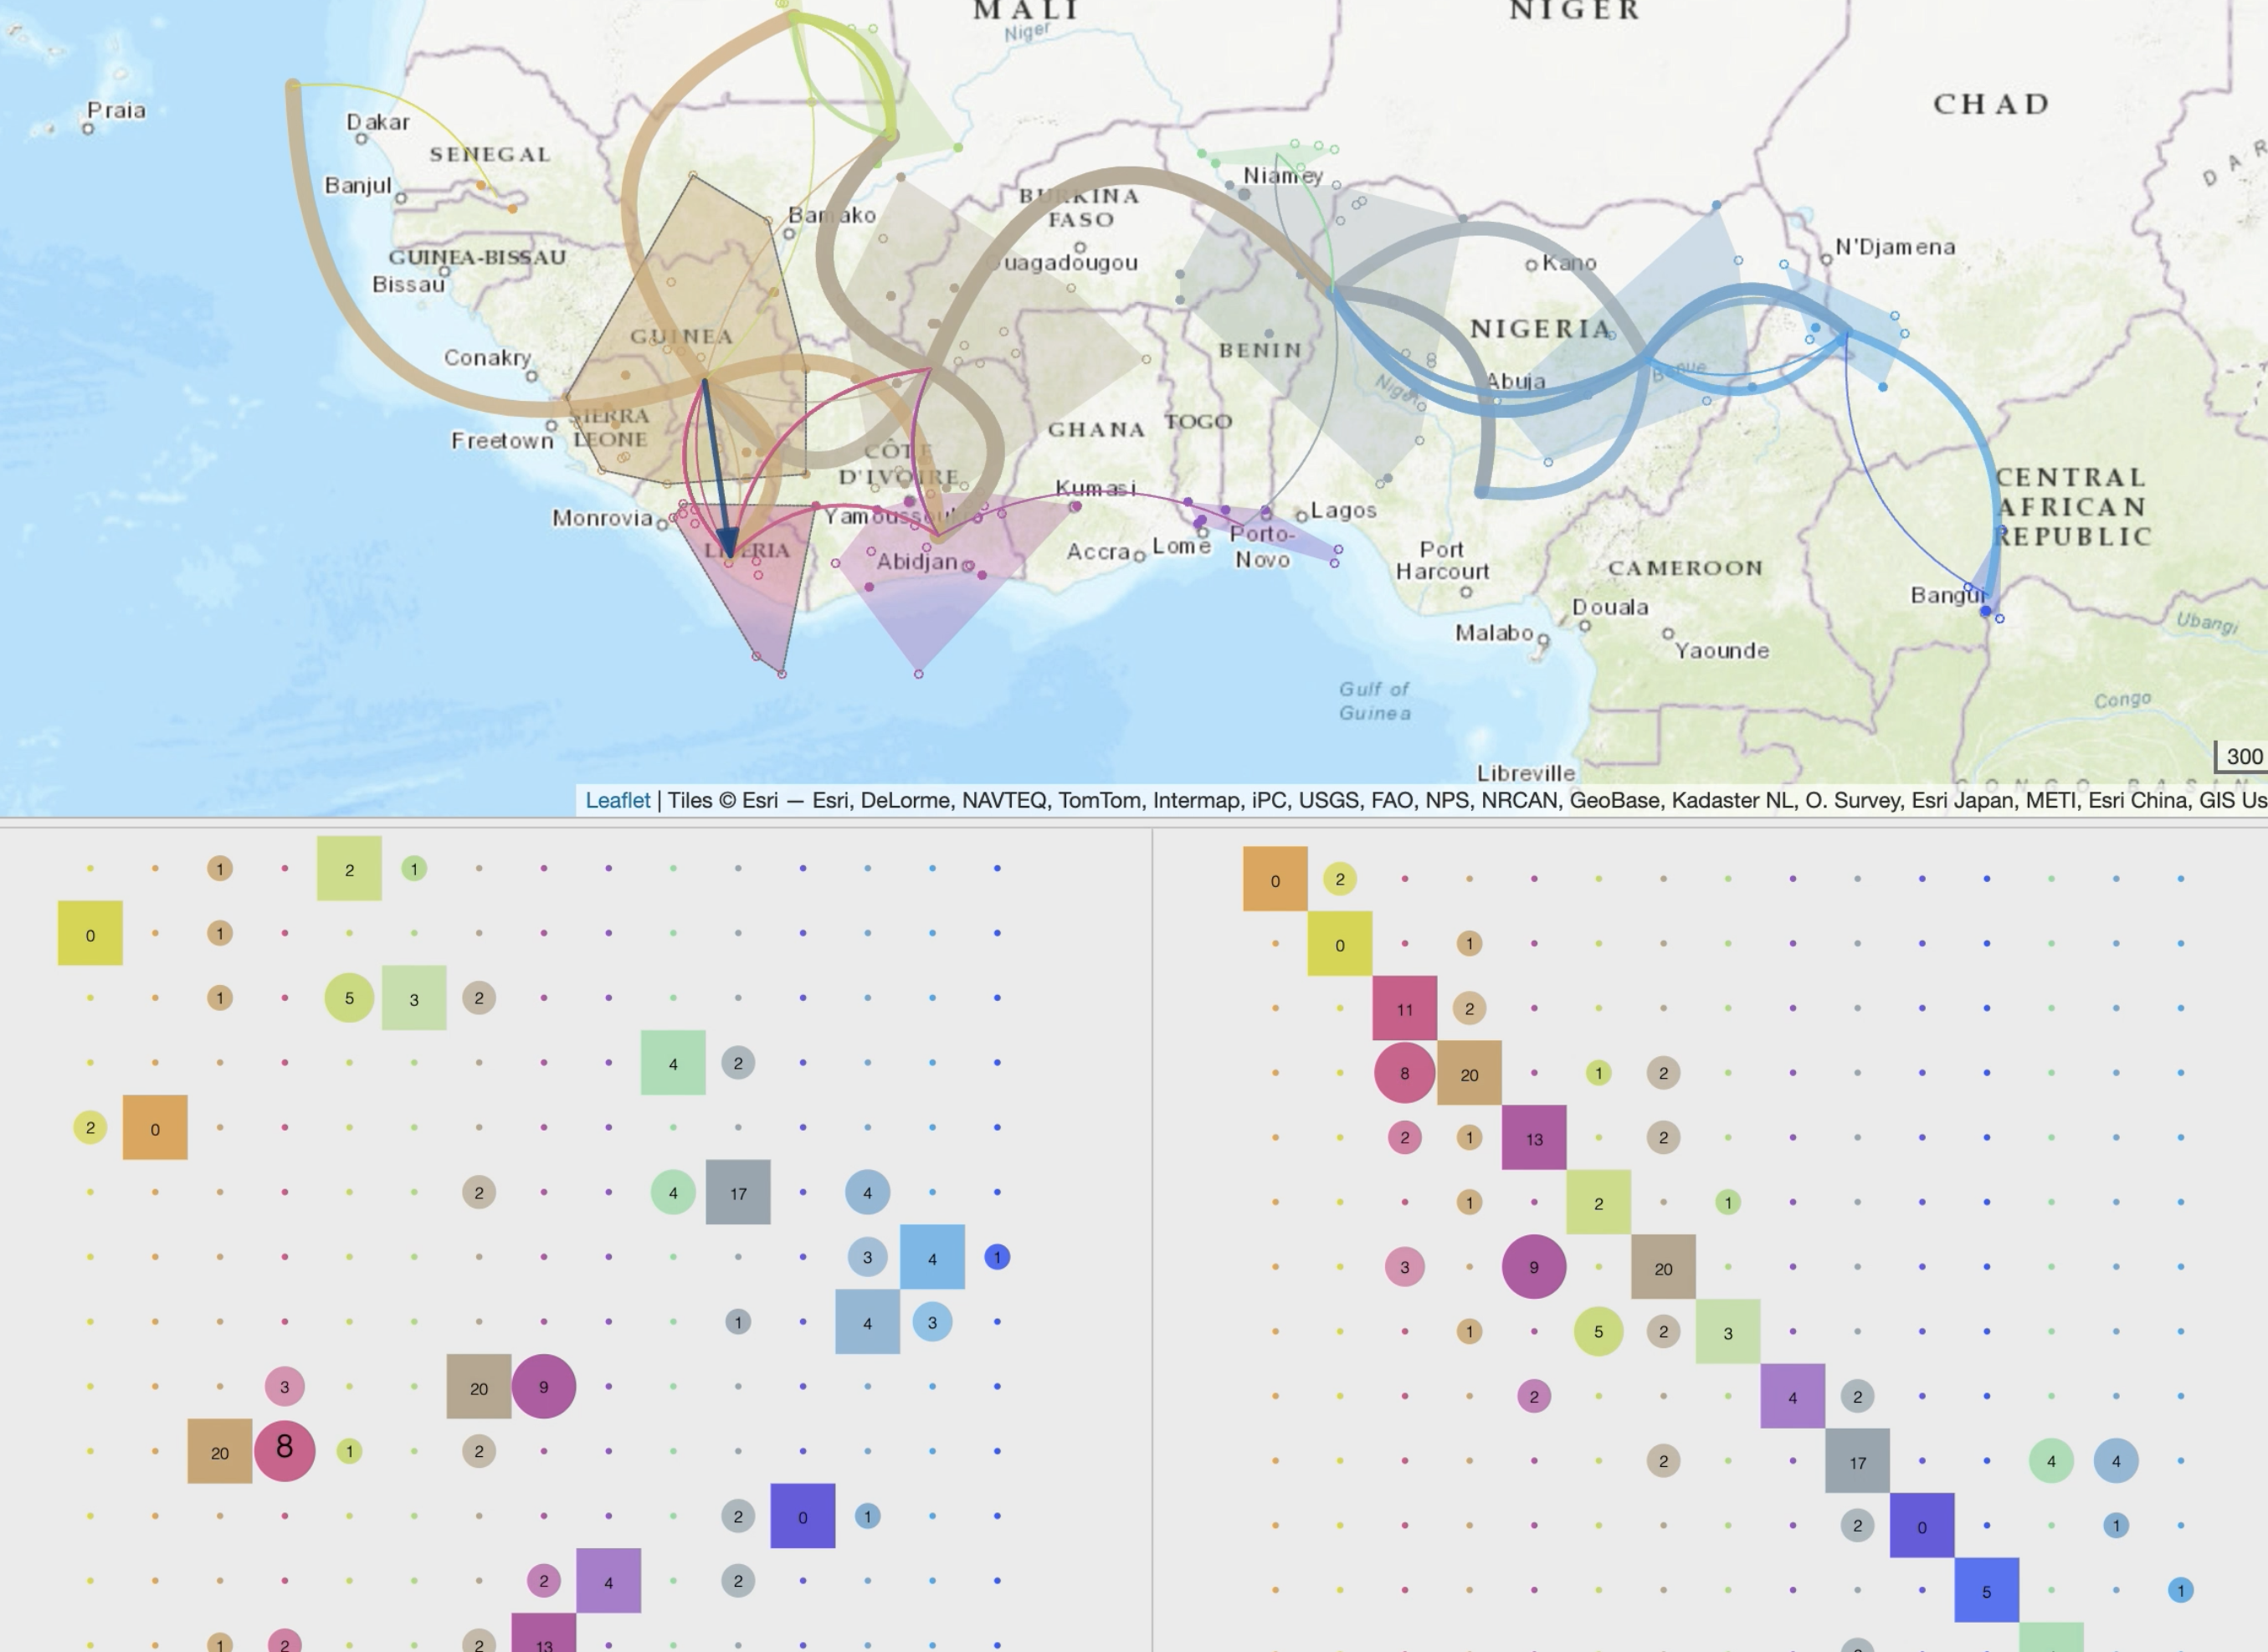
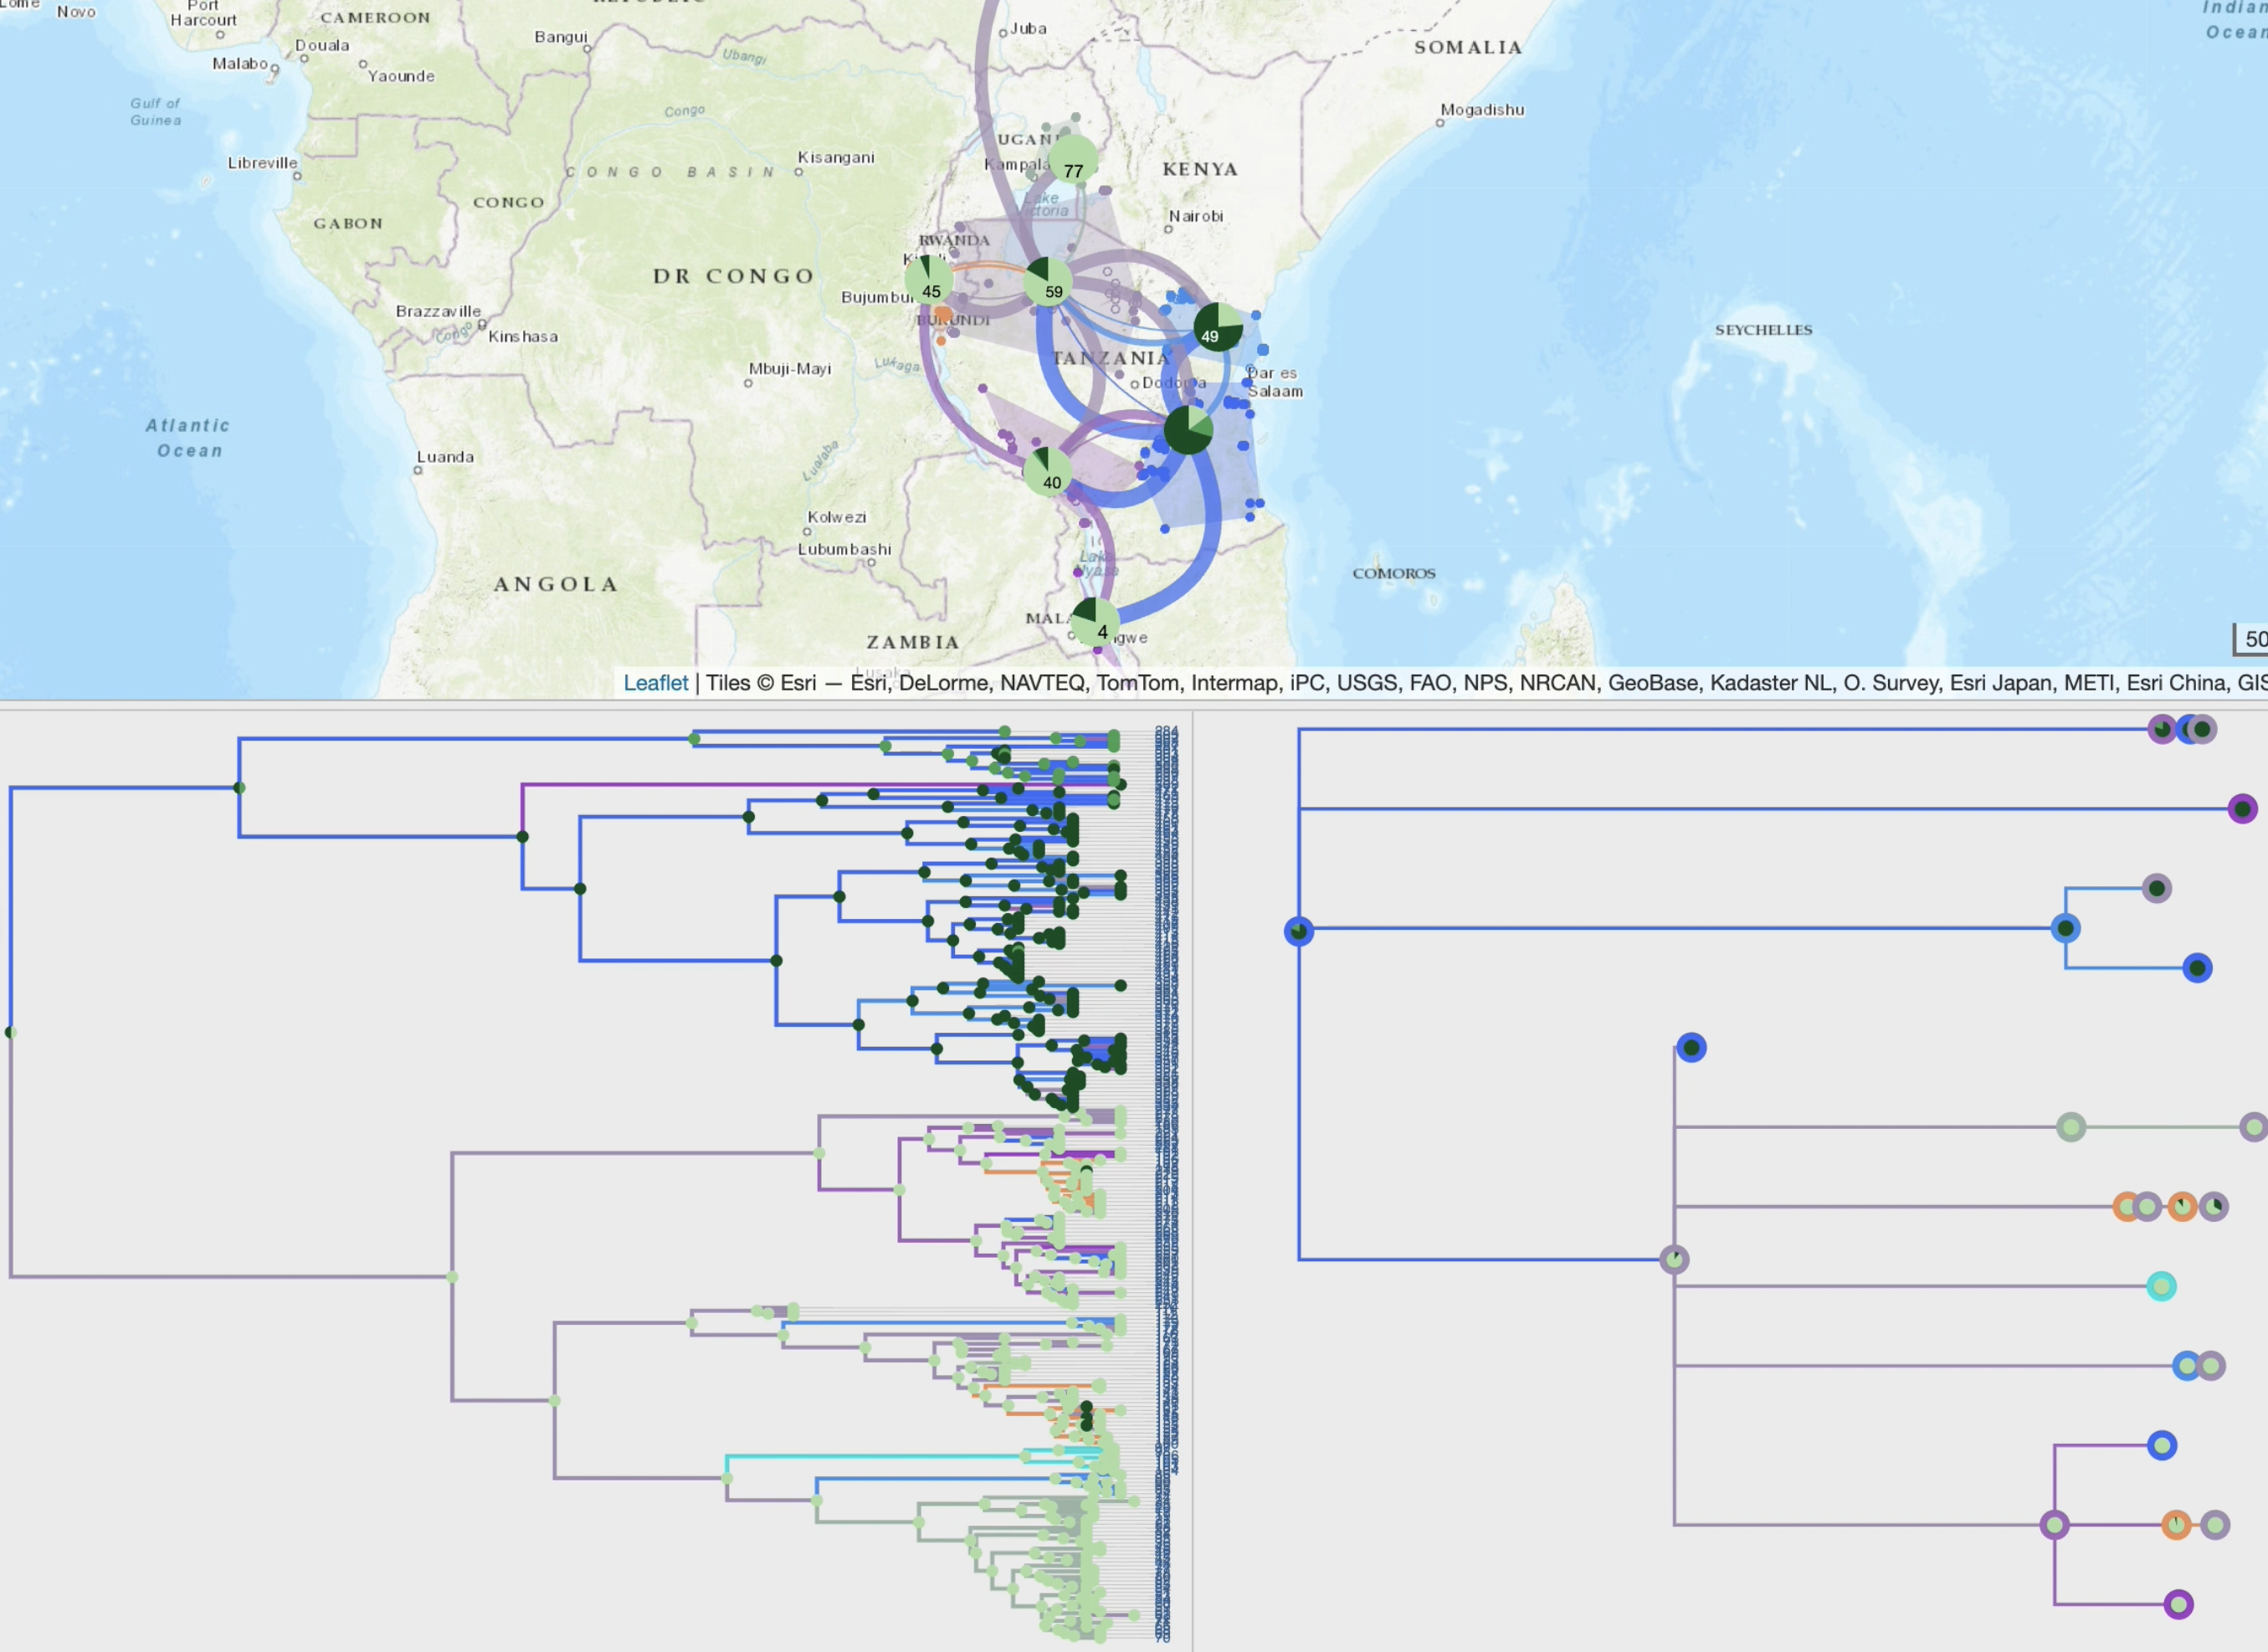
• production of specific spatio-temporal scales and synthetic views through dynamic and iterative clustering of localities into spatial clusters
• animation of the phylogeographic scenario using tree brushing, which can be done manually or automatically, gradually over time or at specific time intervals, and for the entire tree or a specific clade
• an evolving library of additional tools (eg migration distance curves, ancestral character states computed from third-party discrete variables).
Contact: francois.chevenet@ird.fr
|
|
|
